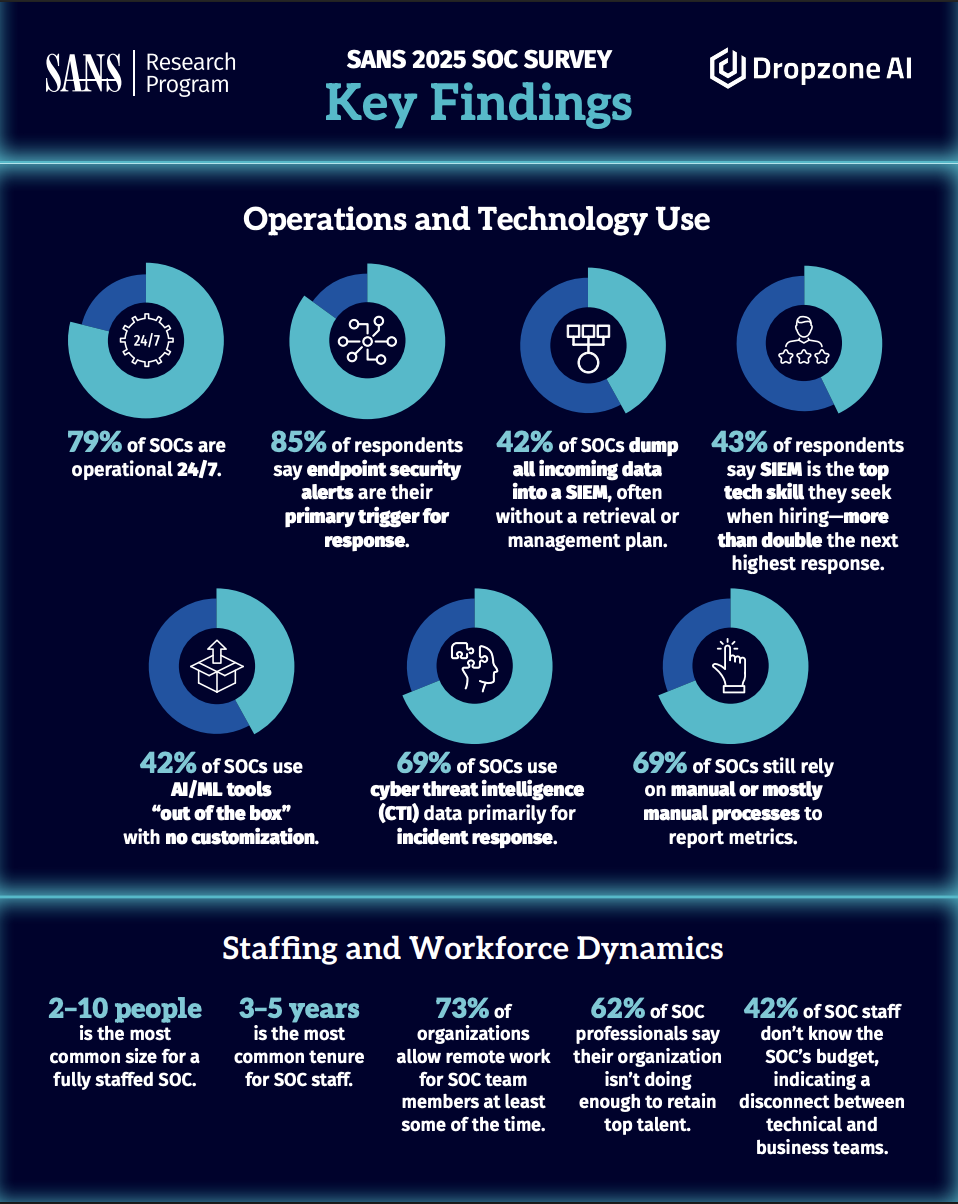
SANS 2025 SOC Survey Key Findings Infographic
Critical Security Operations Insights at a Glance
The SANS 2025 SOC Survey represents the ninth year of industry-leading research into how Security Operations Centers are built, staffed, and run. With responses from security professionals across 57 countries, this comprehensive study reveals both encouraging progress and persistent challenges facing modern SOCs.
This infographic distills 12 of the most impactful statistics from the full survey report, providing security leaders with an immediate visual understanding of the current SOC landscape. From the reality that 79% of SOCs operate 24/7 to the concerning fact that 62% of organizations aren't doing enough to retain talent, these key findings illuminate critical operational and workforce dynamics.
What This Infographic Visualizes
Operations and Technology Use (7 Key Statistics)
The top section of our infographic captures the operational reality of modern SOCs through carefully selected metrics:
Round-the-Clock Operations: The 79% figure showcases how most SOCs maintain continuous vigilance, illustrated with a clock icon to emphasize 24/7 coverage.
Alert Source Priority: With 85% of respondents identifying endpoint security alerts as their primary response trigger, this statistic reflects EDR's position as the most trusted and mature tool in the SOC technology stack.
SIEM Data Management Crisis: The visualization highlights that 42% of SOCs dump all data into their SIEM without retrieval plans—what the full report calls "a visibility strategy that risks collapsing under its own weight."
Skills Gap Reality: SIEM expertise requirements at 43% (more than double other skills) reveals the technology-dependent nature of modern SOCs and the specific competencies organizations struggle to find.
AI/ML Underutilization: The 42% using AI/ML tools "out of the box" represents what the report identifies as tools that "waste budget, add risk, and fail to deliver meaningful support" without proper integration.
Threat Intelligence Application: With 69% using CTI data primarily for incident response, this reflects the reactive nature of most SOC operations rather than proactive threat hunting.
Manual Process Burden: The persistence of manual metrics reporting in 69% of SOCs demonstrates the gap between available automation and actual implementation.
Staffing and Workforce Dynamics (5 Key Statistics)
The bottom section reveals the human challenges behind SOC operations:
Team Size Standard: The 2-10 person range aligns with the report's finding that 10 full-time equivalents represent the optimal baseline for most organizations.
Retention Challenge: The 3-5 year tenure pattern and 62% dissatisfaction with retention efforts paint a picture of ongoing workforce instability.
Remote Work Reality: The 73% allowing remote work reflects post-pandemic workplace flexibility, though the report notes this varies by role and skillset.
Budget Disconnect: The 42% unaware of SOC budgets highlights the disconnect between technical teams and business context.
How Security Leaders Use This Infographic
Strategic Planning and Benchmarking
Compare your SOC's operational metrics against industry standards. Use these statistics to identify gaps and justify resource requests to executive leadership.
Team Discussions and Awareness
Share this visualization in team meetings to spark conversations about operational improvements. The data validates common challenges your team likely faces daily.
Executive Presentations
Include this infographic in board presentations and budget discussions. The visual format makes complex SOC challenges immediately understandable to non-technical stakeholders.
Industry Analysis and Reporting
Reference these statistics in security assessments, vendor evaluations, and strategic planning documents. The SANS brand provides authoritative weight to your arguments.
The Story Behind the Numbers
This infographic represents findings from SANS Institute's ninth annual SOC survey, conducted by Christopher Crowley. The research encompasses responses from security professionals across 57 countries, with strong representation from Banking/Finance (16%), Cybersecurity (14%), Technology (14%), and Government (14%) sectors.
What makes these statistics particularly valuable is their reflection of real-world SOC operations rather than vendor aspirations or theoretical best practices. As the full report notes, "progress takes intention—in hiring, training, architecture, and tool use."
Access the Complete SANS 2025 SOC Survey Report
While this infographic captures critical highlights, the full SANS 2025 SOC Survey provides comprehensive analysis including:
- Detailed methodology and complete demographics of the 57-country participant base
- Deep dives into SOC architecture trends, cloud adoption patterns, and hybrid deployment models
- Comprehensive technology analysis including satisfaction ratings for 15+ security tools
- Threat hunting maturity assessment and why teams struggle with proactive security
- Five reasons for optimism about the future of SOC operations
- Actionable recommendations for addressing staffing, retention, and technology challenges
Gain access to all survey data, year-over-year comparisons, and expert analysis from Christopher Crowley on building more effective security operations.
This infographic is brought to you by Dropzone AI in collaboration with SANS Institute. For more resources on building efficient, AI-augmented security operations that address the challenges highlighted in this research, explore our Resources Hub.

